Starter: Define and discuss scale. (Create a glossary: Add Spatially & Temporally scale)
Task 1: Slide
Task 1: Slide
Task 2: Choropleth Map of Global Population Distribution-2015
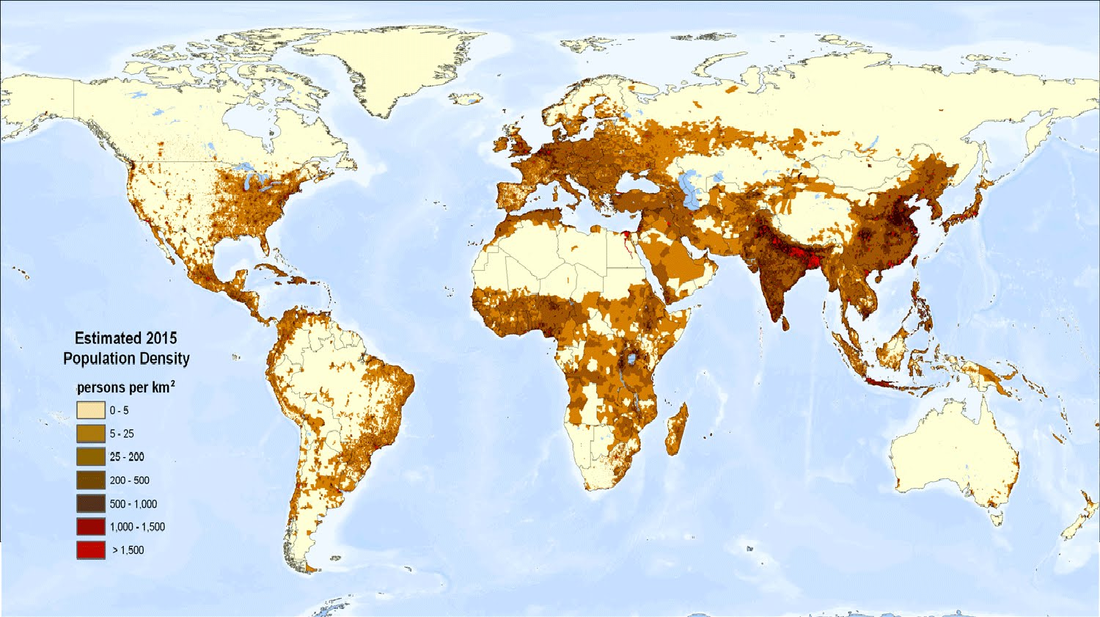
a) Using the map above, describe the population distribution patterns at a global scale. (You should only use the information on the map, including quantification to answer this.)
b) Suggest why the population of the world is distributed in such a way (discuss physical and human reasons).
Task 3: In pairs: Each explain a couple/ few of the maps in the links below and then answer the accompanying questions.
Tip: Aim to make connections between the maps in your explanation.
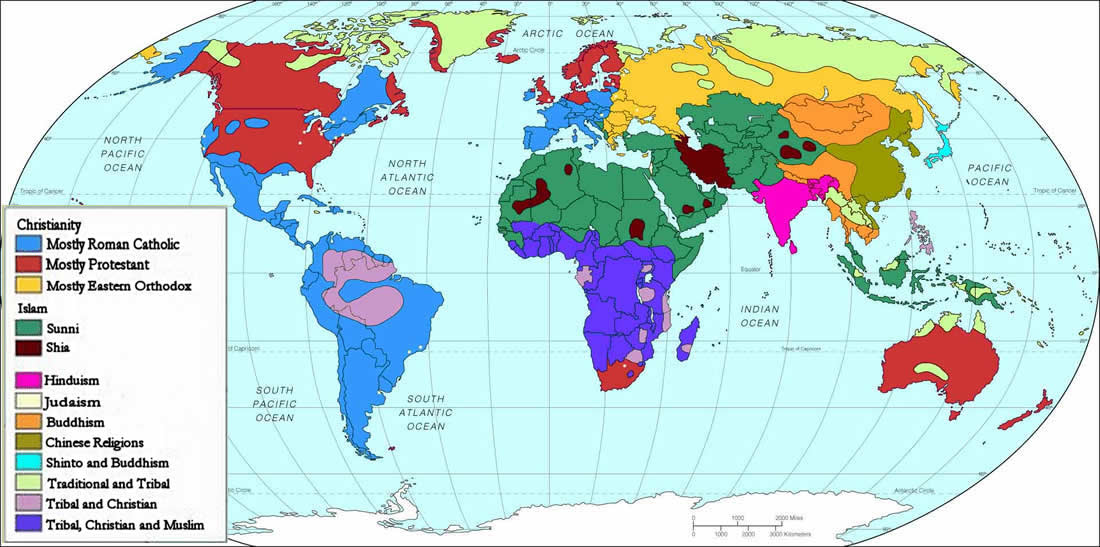
b) Using map evidence from above or your own research, explain the human geographic factors (social, economic, political, cultural) that contribute to global population distribution.
Plenary:
b) Suggest why the population of the world is distributed in such a way (discuss physical and human reasons).
Task 3: In pairs: Each explain a couple/ few of the maps in the links below and then answer the accompanying questions.
Tip: Aim to make connections between the maps in your explanation.
- Global GDP per capita Map
- Natural Vegetation Map of the World
- World Religion Map
- Global Precipitation Map
- Democracy Around the World
b) Using map evidence from above or your own research, explain the human geographic factors (social, economic, political, cultural) that contribute to global population distribution.
Plenary:
- How does population vary between places?
- What are the physical and human factors affecting population distribution at a global scale?
- Do you believe that physical or human factors have the greatest effect on population distribution? Justify your answer with reference to examples.
